|
|
GCE Research Background |
|
On this page, further detail on galactic chemical evolution
is considered.
What Is GCE?
How do we Model GCE?
To model the
Examples of Model Outputs Follow:
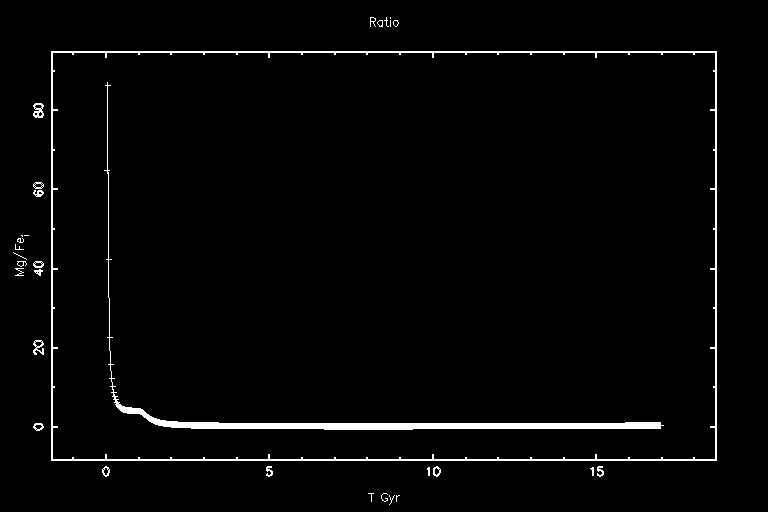
Examples of Log(Star mass fraction) and ISM Mg/Fe ratio versus time from one of our models with a merger occurring at 8 Giga years (click on images to enlargen):
vT.jpg)
Graph of Magnesium Iron abundance
ratio versus absolute time.
Graph of Log stellar metallicity to
solar metallicity versus absolute time.
How do we Observe GCE?
The model is then compared , using statistical methods, to reduced data
from our group's own acquired observations of
In future observations, work will be done to "tie-down" the age of galaxies to help break age-metallicity degeneracy (see below for more on this).
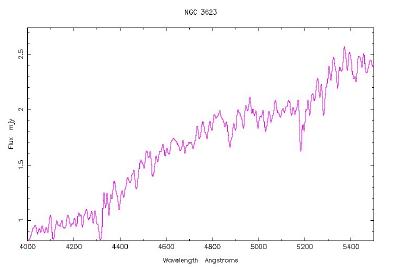
Example Observations
Optical image and WHT spectrum of the Sa galaxy NGC 3623:

Theoretical Modelling
Below, are notes on some of the functions and archived data sources the GCE code employs.
Salpeter Initial Mass Function
The
IMF (E) describes
the distribution of masses after an initial star burst. It specifies the
distribution in mass of a newly formed stellar population and it is
frequently assumed to be a simple power law (see below). A still much used
function that describes this distribution is the modern equivalent of
Salpeter’s formula (Salpeter, 1955). This function is often represented as
a plot of E (which is
usually the number density normalised to unity) against stellar mass.
The IMF :
E(M)=cM-(1+x) with
M being in solar masses, and x without units. The coefficient
c is given
often as a fraction of a solar mass (0.15 M¤ in the case of
Salpeter). The
IMF may be normalised to unity. In general, E
is assumed to extend from a lower to an
(non-observational) upper cut-off, chosen to
be M1=0.1 M¤
and M2=125 M¤ (Bolzonella et al,
2000).
Worthey Spectral Indices
Models that predict the line strengths of spectra of galaxies, specifically spheroidal galaxies, are used in the GCE code (of Sansom & Proctor, CFA UCLan, 2002). Indices have been formulated by a number of researchers; for example, Worthey et al (1994)* , who generate 21 indices from optical observations of stellar spectra. These indices are collectively referred to as the "Lick Indices". The more convincingly a GCE code predicts these line strengths (i.e. indices), the closer to the truth the theories as to GCE that produce that code are thought to be.
The Indices Worthey et al (1994) refer to are:
HdelA, HdelF, CN1, CN2, Ca4227, G4300, HgamA, HgamF, Fe4383, Ca4455, Fe4531, Fe4668, Hbeta, Fe5015, Mg1, Mg2, Mgb, Fe5270, Fe5335, Fe5406 and the Ca triplet line.
*Worthey et al, 1994, ApJS, 95, 1, 107-149.
Vazdekis Spectral Indices
The GCE code reads in data tabulated from an SSP, from Vazdekis et al (1996)*. This paper provided model predictions for SSPs; Broadband colours, mass-to-light ratios and absorption line-strengths at low spectral resolution for SSPs and full chemo-evolutionary models. SSPs spectral energy distributions (SEDs) at moderately high resolution (FWHM=1.8Å) in the optical (ranges 3820-4500 Å and 4780-5460 Å) are used from tables presented in the Vazdekis 1999 paper*. The 1996 paper referred back to
tables of model stellar data that predict line strengths for SSPs from
* Vazdekis et al, 1996, ApJS,107,306 and also Vazdekis 1999, ApJ,513,224.
| Date Last Modified: | Web author: Mark Northeast |
| Date Last Modified: 05/12/02 | Web author: Mark Northeast (MSNortheast@uclan.ac.uk). |