
Dr Roger Clowes leads an international team investigating quasars. More specifically the grouping of quasars together to form a large scale structure but also the enviroment surrounding these quasars and the quasar emission
Quasars are the nuclei of galaxies from the early years of the universe. Quasars undergo brief periods of extremely high brightness that make them visible across huge distances. These periods are ‘brief’ in astrophysics terms but actually last 10-100 million years.
One such structure discovered by Dr Clowes is the Huge-LQG. With a characteristic size (volume1/3) ∼ 500 Mpc (present epoch). Whole clusters of galaxies can be 2-3 Mpc across, but LQGs can be 200 Mpc or more across.
Huge-LQG – the Huge Large Quasar Group
Research
The Huge-LQG (Clowes et al. 2013) at z = 1.27 is a Large Quasar Group (LQG) of characteristic size (volume1/3) ∼ 500 Mpc (present epoch). Its “CHMS-significance” (Clowes et al. 2012, 2013) of 3.81σ expresses the departure of its volume from that expected from a large control sample for the same number N=73 of quasars. The principal axes of the Huge-LQG are 1240, 640, 370 Mpc, so its longest dimension is 1240 Mpc, compared with the characteristic 500 Mpc. MgII absorbers (strong absorbers!) offer some independent evidence of a mass enhancement. The Huge-LQG is one of six that exceed the Yadav et al. scale at ≥ 2.95σ. It is only the third most CHMS-significant of these six, but it has the highest membership and is the largest. The Huge-LQG is ∼ 8.8º N (∼ 615 Mpc) of the older Clowes & Campusano (1991) LQG (CCLQG) at the same z = 1.28; their boundaries approach to ∼ 2º (∼140 Mpc). Work is in progress using the Horizon Run simulations (Kim et al. 2012) to establish whether these very large overdensities are compatible with the concordance cosmological model.
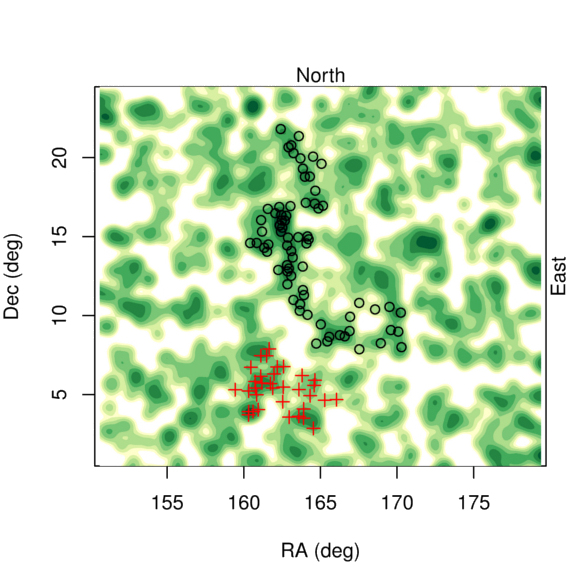
Figure 1. Sky distribution of the 73 quasars of the Huge-LQG ( = 1.27, circles) is shown, together with that of the 34 quasars of the older CCLQG ( = 1.28, crosses). The members of each LQG are connected at the linkage scale of 100 Mpc. The area shown is approximately 29.5º×24.0º. The SDSS DR7QSO quasars are limited to i ≤ 19.1. Superimposed on these distributions is a kernel-smoothed intensity map (isotropic Gaussian kernel, σ = 0.4º), plotted with logarithmic palette levels (≤ 0.460, 0.460-0.651, 0.651-0.920, 0.920-1.301, 1.301-1.840, 1.840-2.602, 2.602-3.680, ≥ 3.680 deg−2), for all of the quasars in the joint redshift range of the Huge-LQG and the CCLQG (z: 1.1742 → 1.4232).
Figure 2. Snapshot from a visualisation of both the Huge-LQG and the older CCLQG. The scales shown on the cuboid are proper sizes (Mpc) at the present epoch. The tick marks represent intervals of 200 Mpc. The Huge-LQG appears as the upper LQG. For comparison, the members of both are shown as spheres of radius 33.0 Mpc (half of the mean linkage for the Huge-LQG; the value for the CCLQG is 38.8 Mpc). For the Huge-LQG, note the dense, clumpy part followed by a change in orientation and a more filamentary part. There is no difference in linkage properties that might suggest two LQGs. The Huge-LQG and the CCLQG appear to be distinct entities.
This work has used the SDSS DR7QSO catalogue (Schneider et al. 2010) and the SDSS spectra.
Media Coverage
References
- Clowes R.G., Campusano L.E., 1991, MNRAS, 249, 218
- Clowes R.G., Campusano L.E., Graham M.J., Söchting I.K., 2012, MNRAS, 419, 556
- Clowes R.G., Harris K.A., Raghunathan S., Campusano L.E., Söchting I.K., Graham M.J., 2013, MNRAS, 429, 2910
- Kim J., Park C., Rossi G., Lee S. M., Gott J.R., 2012, JKAS, 44, 217
- Schneider D.P. et al., 2010, AJ, 139, 2360
- Yadav J.K., Bagla J.S., Khandai N., 2010, MNRAS, 405, 2009
Strong / Ultrastrong UV FeII Quasars – Environments
UV FeII emission is stronger in LQG quasars. Quasars in LQGs in general, and including the Huge-LQG (Clowes et al. 2013a), have recently been discovered to have statistically stronger UV FeII emission, with the strongest FeII emitters – the ultrastrong emitters – also showing evidence for a preferred nearest-neighbour scale to other quasars (Clowes et al. 2013b; Harris et al. 2012; Harris 2011). We use the Weymann et al. (1991) W2400 equivalent width, defined between the rest-frame continuum windows 2240-2255 and 2665-2695 Å, as the measure of the UV FeII emission. We find a significant shift of the W2400 distribution to higher values for quasars within LQGs, predominantly for those LQGs with 1.1 ≤ ≤ 1.5. There is a tentative indication that the shift to higher values increases with the quasar i magnitude. We find evidence that within LQGs the ultrastrong emitters with W2400 ≥ 45 Å (more precisely, ultrastrong-plus with W2400 ≥ 44 Å) have preferred nearest-neighbour separations of ∼ 30-50 Mpc to the adjacent quasar of any W2400 strength. No such effect is seen for the ultrastrong emitters that are not in LQGs. The possibilities for increasing the strength of the FeII emission appear to be iron abundance, Lyα fluorescence and microturbulence, and probably all of these operate. The dense environment of the LQGs may have led to an increased rate of star formation and an enhanced abundance of iron in the nuclei of galaxies. Similarly, the dense environment may have led to more active blackholes and increased Lyα fluorescence. The preferred nearest-neighbour separation for the stronger emitters would appear to suggest a dynamical component, such as microturbulence.
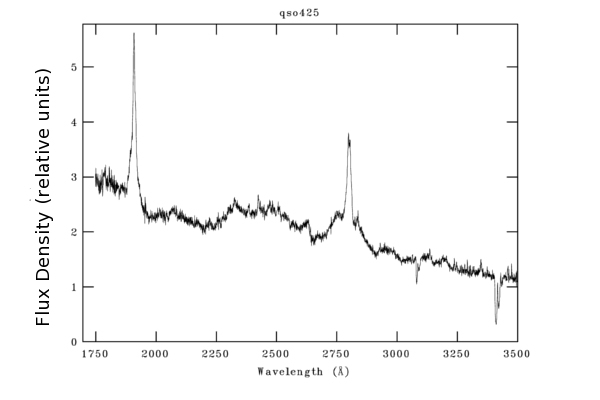
Figure 3. MMT / Hectospec spectrum (rest-frame) of an ultrastrong UV FeII emitting quasar. Note the FeII emission between ~ 2255-2650 Å.
This work has used the SDSS DR7QSO catalogue (Schneider et al. 2010) and the SDSS spectra.
References
- Clowes R.G., Harris K.A., Raghunathan S., Campusano L.E., Söchting I.K., Graham M.J., 2013a, MNRAS, 429, 2910
- Clowes R.G., Raghunathan S., Söchting I.K., Graham M.J., Campusano L.E., 2013b, MNRAS, 433, 2467
- Harris K. A., 2011, PhD thesis, Univ. Central Lancashire
- Harris K. A., Clowes R. G., Williger G. M., Haberzettl L. G., Campusano L. E., 2012, in Boissier S., de Laverny P., Nardetto N., Samadi R., Valls- Gabaud D., Wozniak H., eds, SF2A-2012: Proc. Annu. Meeting French Soc. Astron. Astrophys., p. 469
- Schneider D.P. et al., 2010, AJ, 139, 2360
- Weymann R. J., Morris S. L., Foltz C. B., Hewett P. C., 1991, ApJ, 373, 23